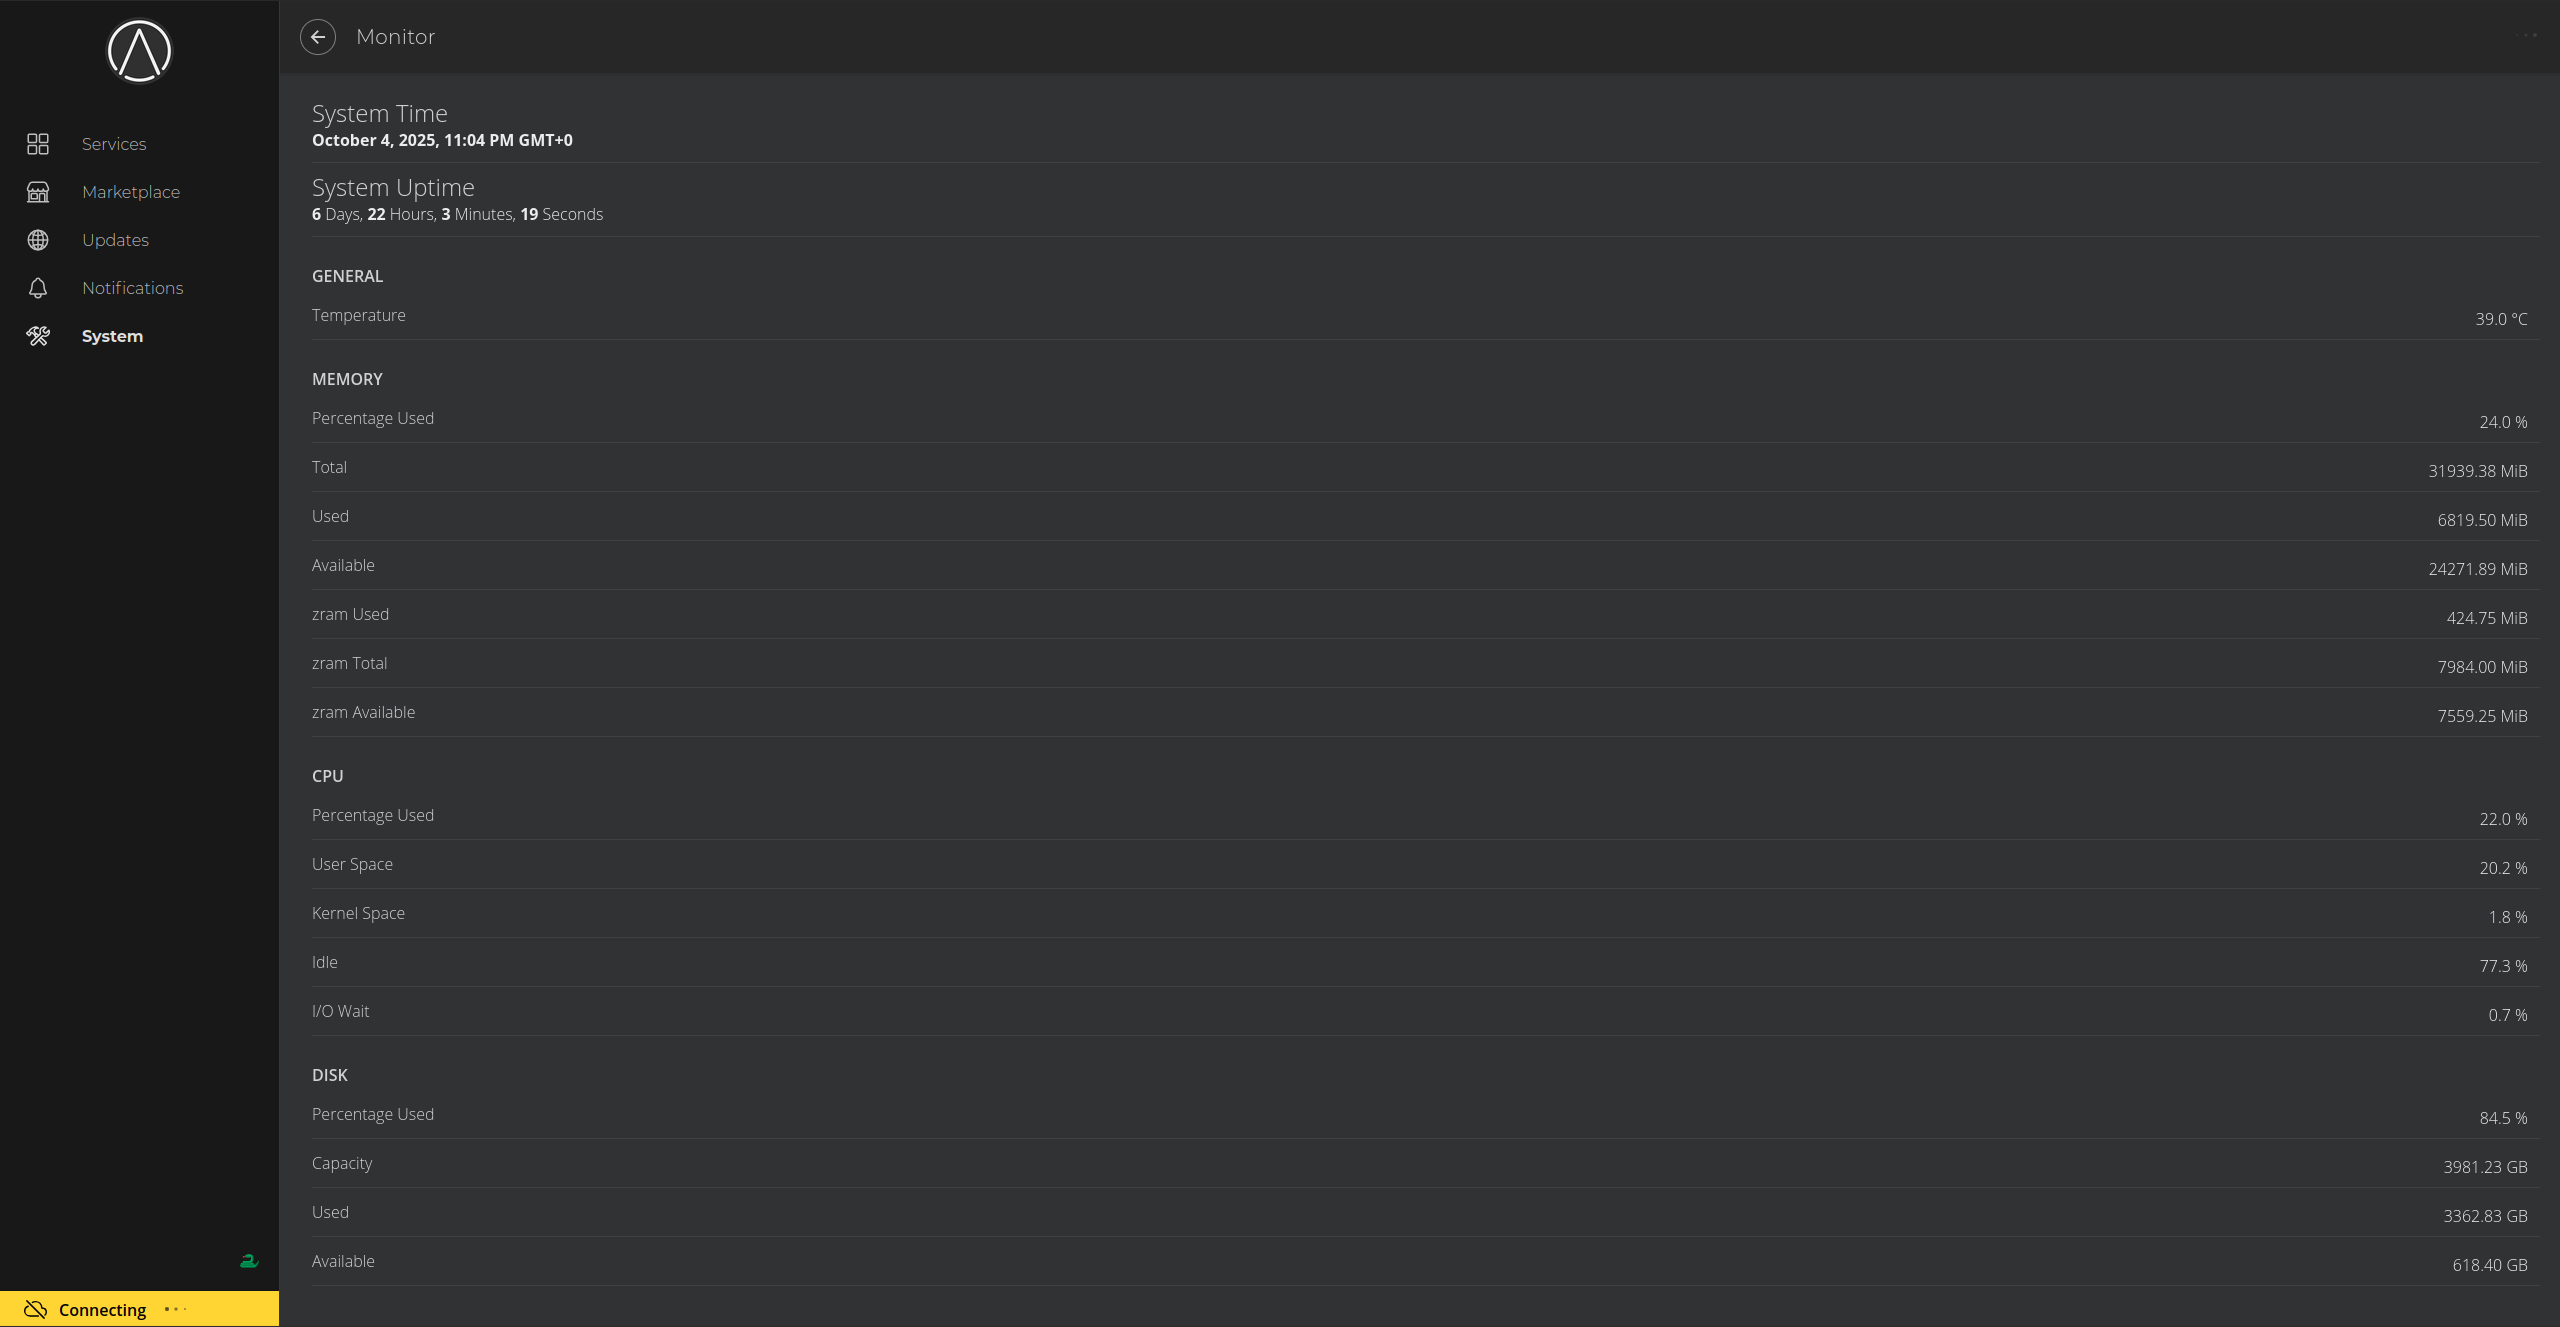
Searching on this topic showed only one post that unfortunately wasn’t helpful.
Is there a way to see each services CPU percentage use?
My CPU only recently has been at 100% and suspect that it may be a service.
I usually have tabs open showing the different services that I want to keep an eye on including the StartOS monitor page itself, will this cause higher CPU usage?
What do you mean by tabs open? Are you talking about your client device (Windows, Mac, Linux, Android, iOS device)?
Or have you connected a monitor to a server? A 100% CPU usage would suggest something is amiss. If you made the mistake of treating a home server as a PC and you’re running it what we call “kiosk mode”, then extensive use of the cut down Firefox might lead to higher resource use… but it’s unlikely to be heavy on just the processor.
To work out what’s going on, you’d need to switch over to your client device, set up SSH (Start9 | Using SSH) then you’ll be able to log in and run standard linux commands. htop for example.
Using Librewolf on my Linux desktop, I’m just at the .local address to access my services so I have several tabs open to show them.
My StartOS is built on a mini PC with 32Gb ram and 4TB SSD.
I did finally do a restart and it fixed the CPU usage for now, so it’s not the tabs but I would still like to see each services CPU usage just to see if it’s any one in particular that is causing an issue if it happens again.
I’ll follow the SSH link you gave and move forward from there, if you have any other suggestions, I appreciate it!
If it happens again before you finish setting up SSH (which is EASY on Linux) and could also just stop each service one by one to work out which it is. Then check the logs for that service to see what’s going wrong.
So I didn’t have a 100% CPU event but I did have another crash which has been happening about every few days. I suspect they’re related.
I cannot access my dashboard via .local or Onion but I was able to access one of my services via TOR which means the server itself is working.
I did follow through on your SSH suggestion and now I’m sitting here looking at a connected terminal window with no idea what to do next since this is my first time SSHing into anything.
Is there a document somewhere showing the different commands or process to check my different services to narrow down and shut down so I can gain access to my dashboard again?
Okie Dokie,
So the only major thing that I found was under HTOP, no CPU activity and every service showed “sleeping” except for three lines showing “Zombie”.
After restart there was again CPU activity and varying status’ of “Running”, “Disk Sleep”, "and “Sleeping” with everything except Fulcrum (explained below), functioning properly as far as I can tell.
The questions are, what would put every function to “Sleeping” mode and
why was I able to access some services if they all showed sleeping?
Specific to your questions-
Podman- did any crash?
No
htop- does anything look out of place?
As mentioned above, no CPU usage and everything “Sleeping”.
dmesg- serious errors in the logs
This is the oddest one. The only thing that shows in the logs is a thousand lines of “UFW BLOCK” and something about my VPN. Maybe filtering because of my VPN and only showing info from that?
The only other clearly broken thing is that Fulcrum will not start. It cycles quickly from “Starting” to “Running” with the health checks and back to running over and over and over.
I only just saw that Fulcrum has Bitcoin Knots as a dependency so that could be the issue here? I do not run Knots and so may have to abandon Fulcrum for now and go back to electrs. Am I on the right track here?
A process in sleep mode just means it’s waiting for an event, such as an input from the user, or a response from another process or device.
Fulcrum should work with Core, just as “poorly” as it works with Knots. If you want a reliably functioning server however, you shouldn’t be using software from the Beta registries. Certainly not while you are having other issues with your server. The beta registries are for experimenting, ans testing only.
If your server appears to be on, but not responding to it’s adjective-noun.local address, it may have dropped into diag mode. Try start.local
Understood on the sleep mode.
I figured that was the case on the Beta registry services but that’s the only place that Fulcrum was available and I was trying to solve an issue with Electrs. But I’ll uninstall Fulcrum and see if the system stays up from then.
I only knew of the adjective-noun.local and the .onion address, are you saying that just start.local should work? (it didn’t)
The sequence seems to be that I can’t access at the .local or .onion address’, then after a few minutes, I can’t SSH in or if I had SSH’d in it will kick me. Then about that time or a few minutes later, all services will have stopped and I will have to hard re-boot and then it works fine for a day or three.
Yea, Fulcrum is not quite ready for production on SartOS. Definitely remove that until you’ve been able to get your server to function properly otherwise.
The start.local address is only accessible during initial setup, or if the system drops into diag mode. If the server won’t respond to the adjective-noun.local address, the .onion address, or start.local, then either the server has become unresponsive. Or you have a separate issue with the client machine, or network, not allowing you to reach the server. You might want to connect a mouse monitor, and keyboard to access your server through what we call kiosk mode. The interface likely won’t show up if the server is already on. The monitor needs to be connected before you power on the server.
I’m readdressing this because it’s still happening and also just so odd.
To be clear, it’s not the 100% CPU usage of the original title but it’s similar and I’m referencing the posts from Stu and Rexter above so I posted it here.
Often (every few days or so) my Jellyfin will stop playing and then I cannot access my local address via any of the ways mentioned by Rexter above.
I can SSH in and I run the various checks mentioned by Stu above and everything looks ok. The server looks to be running with no apparent anomalies.
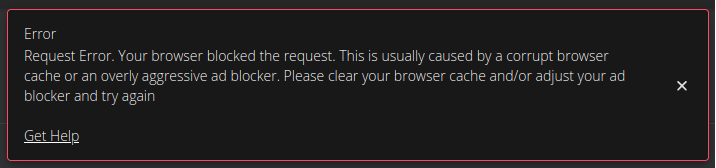
I can access some service’s pages but others say “The Connection Has Timed Out”.
Really I’m just reporting here in the event others have this issue because I’m pretty much resolving myself to the likelihood that it’s just a hardware issue and will reboot every few days.
I just really hope I can resolve this for when I need to use my services remotely some day.
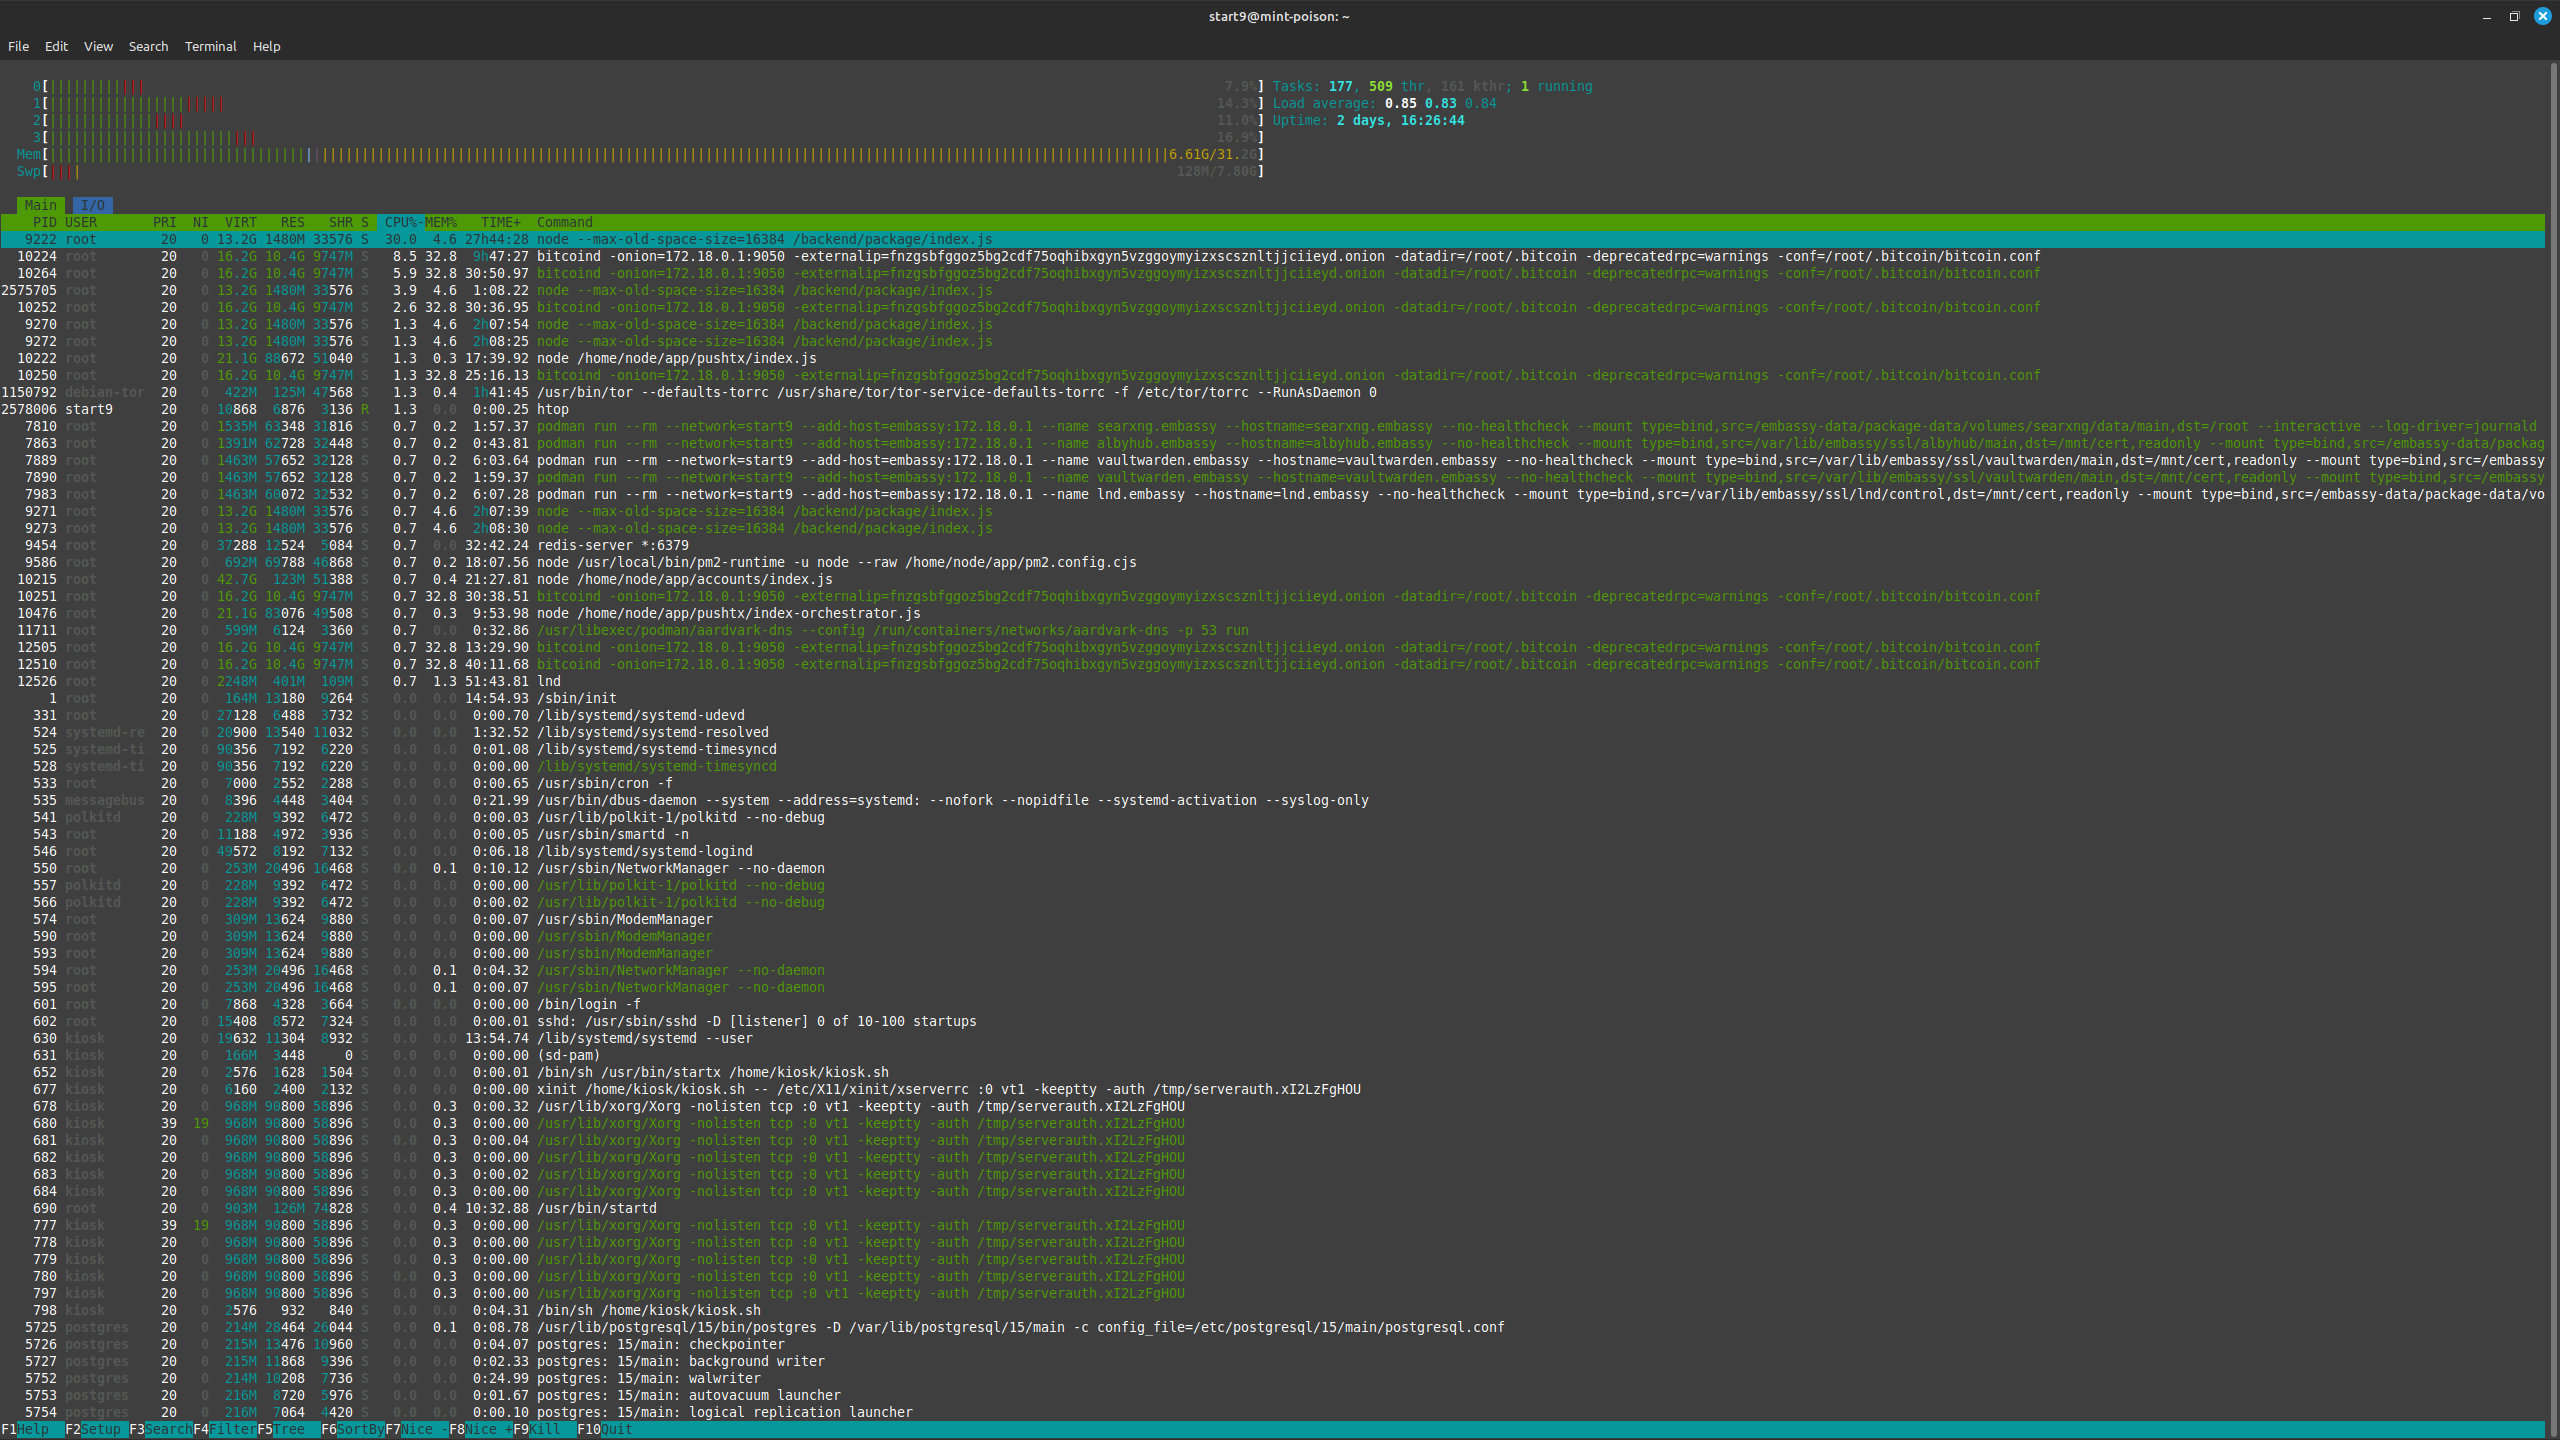
I would love to see a screenshot of what you see when you run htop from ssh, when the server is in a state where it does not respond to the adjective-noun.local address in the browser.
I thought it could be the browser but Firefox was the same.
With all that, I can’t access any Start9 pages or services from browser and I think even Jellyfin will stop playing eventually but I usually reboot before that happens.
Dang it Stu, I’m sorry but I didn’t even see this until recently. I’ve had serious family issues that has taken me away from, well, everything.
I hope to be able to sit down and dedicate the time to figuring this out but in the mean time I just look forward to rebooting every day or two.
I did see this issue submitted that seems to explain the same thing I’m experiencing but so far, it looks like there is no resolution there, either…