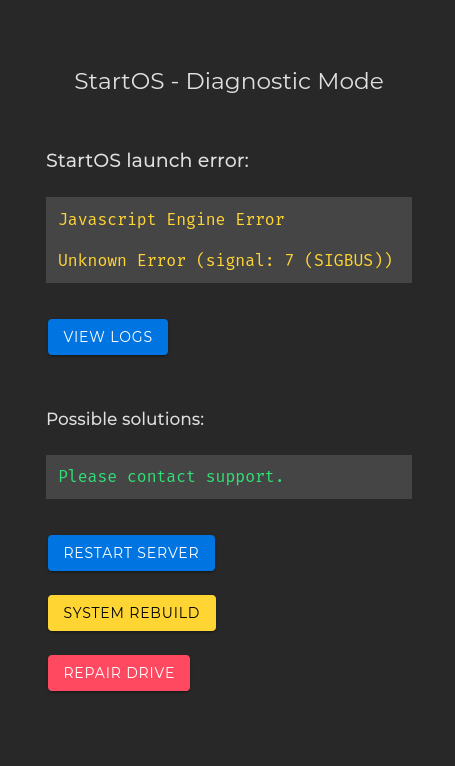
TL;DR: Stuck in Diagnostic Mode “Javascript Engine Error, Unknown Error (signal: 7 (SIGBUS))”. Log shows the Rust process experiencing timeouts.
Hi!
I’ve been happily running the Raspberry Pi Embassy hardware, keeping my StartOS version fairly up-to-date - StartOS: v0.3.5.1 (latest release on GitHub at time of writing).
Running services:
- Bitcoin Core
- C(ore) Lightning
- Electrs
- Mempool(.space)
- File Browser
- Syncthing
- Gitea
Have some other services installed but deactivated as far as I recall.
Recently, I experienced issues using my node from Sparrow Wallet on another machine.
That prompted me to check the web GUI. It gave me the “StartOS - Diagnostic Mode” screen.
I’ve tried restarting a bunch of times by holding the physical power button. What I think finally helped was picking “System Rebuild”. I’m able to successfully use the node with my remote Sparrow Wallet. However, the Diagnostic Mode screen still shows in place of the web GUI.
The log shows a repeated variant of:
2025-04-14T11:19:18+02:00 2025-04-14T09:19:18.695082Z ERROR run_main: startos::manager: Failed to run health check for mempool: Timeout Error: deadline has elapsed
2025-04-14T11:19:18+02:00 2025-04-14T09:19:18.696791Z DEBUG run_main: startos::manager: Error { source:
2025-04-14T11:19:18+02:00 0: deadline has elapsed
2025-04-14T11:19:18+02:00 Location:
2025-04-14T11:19:18+02:00 /rustc/cc66ad468955717ab92600c770da8c1601a4ff33/library/core/src/convert/mod.rs:716
2025-04-14T11:19:18+02:00 ━━━━━━━━━━━━━━━━━━━━━━━━━━━━━━━━━━ SPANTRACE ━━━━━━━━━━━━━━━━━━━━━━━━━━━━━━━━━━━
2025-04-14T11:19:18+02:00 0: startos::procedure::js_scripts::execute
2025-04-14T11:19:18+02:00 at startos/src/procedure/js_scripts.rs:71
2025-04-14T11:19:18+02:00 1: startos::procedure::execute
2025-04-14T11:19:18+02:00 at startos/src/procedure/mod.rs:60
2025-04-14T11:19:18+02:00 2: startos::status::health_check::check
2025-04-14T11:19:18+02:00 at startos/src/status/health_check.rs:71
2025-04-14T11:19:18+02:00 3: startos::manager::health::check
2025-04-14T11:19:18+02:00 at startos/src/manager/health.rs:11
2025-04-14T11:19:18+02:00 4: startos::manager::run_main
2025-04-14T11:19:18+02:00 at startos/src/manager/mod.rs:652
2025-04-14T11:19:18+02:00 Backtrace omitted. Run with RUST_BACKTRACE=1 environment variable to display it.
2025-04-14T11:19:18+02:00 Run with RUST_BACKTRACE=full to include source snippets., kind: Timeout, revision: None }
2025-04-14T11:19:18+02:00 2025-04-14T09:19:18.740543Z DEBUG run_main:check: startos::manager::health: Checking health of syncthing
2025-04-14T11:19:18+02:00 2025-04-14T09:19:18.765407Z DEBUG run_main:check: startos::manager::health: Checking health of gitea
2025-04-14T11:19:22+02:00 2025-04-14T09:19:22.748262Z DEBUG run_main:check: startos::manager::health: Checking health of filebrowser
2025-04-14T11:19:29+02:00 2025-04-14T09:19:29.318501Z DEBUG run_main:check: startos::manager::health: Checking health of bitcoind
2025-04-14T11:19:29+02:00 2025-04-14T09:19:29.895346Z DEBUG run_main:check: startos::manager::health: Checking health of c-lightning
2025-04-14T11:19:33+02:00 2025-04-14T09:19:33.700784Z DEBUG run_main:check: startos::manager::health: Checking health of mempool
2025-04-14T11:19:33+02:00 2025-04-14T09:19:33.784243Z DEBUG run_main:check: startos::manager::health: Checking health of electrs
2025-04-14T11:19:38+02:00 2025-04-14T09:19:38.240358Z DEBUG run_main:check: startos::manager::health: Checking health of filebrowser
It seems to be timing out for either Syncthing, Gitea or Mempool.
Recent things I’ve done via the web GUI as far as I remember.
- Updated some service… don’t recall which.
- Further back: Added SSH key in the process of writing Start9 Core Lightning node as Stacker.News wallet - Solution \ stacker news ~meta
Luckily the SSH key allows me to (very slowly) log in, grab the StartOS version detailed in the beginning.
start9@start:~$ df
Filesystem                                   1K-blocks      Used Available Use% Mounted on
udev                                           3753760         0   3753760   0% /dev
tmpfs                                           805092      1536    803556   1% /run
overlay                                        4025452     64604   3960848   2% /
/dev/mmcblk0p2                                 7299708   5477468   1430036  80% /media/embassy/next
tmpfs                                          4025452       100   4025352   1% /dev/shm
tmpfs                                             5120         0      5120   0% /run/lock
/dev/mmcblk0p1                                  258095     74358    183738  29% /boot
/dev/mapper/EMBASSY_<redacted>_main            8138532   1248356   6455184  17% /embassy-data/main
/dev/mapper/EMBASSY_<redacted>_package-data 1913453332 874918548 941262976  49% /embassy-data/package-data
tmpfs                                           805088         0    805088   0% /run/user/1000
htop:
Couldn’t include screenshot since I’m a new user. :\ But nothing shocking, half the 2GB swap is used. The 4 cores oscillating mostly around 45%.
Top processes in screenshot by CPU (all around 20%):
- check-rpc.sh
- bitcoind
- check-synced.sh
- node --max-old-space-size=16384 /backend/package/index.js
dmesg:
[449204.553186] mmc0: Got data interrupt 0x00000002 even though no data operation was in progress.
[449212.745145] mmc0: Got data interrupt 0x00000002 even though no data operation was in progress.
[449221.193151] mmc0: Got data interrupt 0x00000002 even though no data operation was in progress.
[449221.193292] I/O error, dev mmcblk0, sector 7765368 op 0x0:(READ) flags 0x0 phys_seg 1 prio class 2
[449229.385176] mmc0: Got data interrupt 0x00000002 even though no data operation was in progress.
[449237.577138] mmc0: Got data interrupt 0x00000002 even though no data operation was in progress.
[449245.769172] mmc0: Got data interrupt 0x00000002 even though no data operation was in progress.
[449245.769352] I/O error, dev mmcblk0, sector 7765368 op 0x0:(READ) flags 0x0 phys_seg 1 prio class 2
[449250.574990] brcmfmac: brcmf_cfg80211_set_power_mgmt: power save enabled
[449253.961137] mmc0: Got data interrupt 0x00000002 even though no data operation was in progress.
[449262.153135] mmc0: Got data interrupt 0x00000002 even though no data operation was in progress.
[449270.345132] mmc0: Got data interrupt 0x00000002 even though no data operation was in progress.
[449270.345247] I/O error, dev mmcblk0, sector 7765368 op 0x0:(READ) flags 0x0 phys_seg 1 prio class 2
[449278.537136] mmc0: Got data interrupt 0x00000002 even though no data operation was in progress.
[449286.729140] mmc0: Got data interrupt 0x00000002 even though no data operation was in progress.
[449294.921130] mmc0: Got data interrupt 0x00000002 even though no data operation was in progress.
[449294.921212] I/O error, dev mmcblk0, sector 7765368 op 0x0:(READ) flags 0x0 phys_seg 1 prio class 2
[449303.113132] mmc0: Got data interrupt 0x00000002 even though no data operation was in progress.
[449311.305132] mmc0: Got data interrupt 0x00000002 even though no data operation was in progress.
[449319.497129] mmc0: Got data interrupt 0x00000002 even though no data operation was in progress.
[449319.497416] I/O error, dev mmcblk0, sector 7765368 op 0x0:(READ) flags 0x0 phys_seg 1 prio class 2
[449339.581124] mmc0: Got data interrupt 0x00000002 even though no data operation was in progress.
[449347.773157] mmc0: Got data interrupt 0x00000002 even though no data operation was in progress.
[449355.965115] mmc0: Got data interrupt 0x00000002 even though no data operation was in progress.
[449355.965197] I/O error, dev mmcblk0, sector 7765368 op 0x0:(READ) flags 0x0 phys_seg 1 prio class 2
[449364.157143] mmc0: Got data interrupt 0x00000002 even though no data operation was in progress.
[449372.349112] mmc0: Got data interrupt 0x00000002 even though no data operation was in progress.
[449380.541146] mmc0: Got data interrupt 0x00000002 even though no data operation was in progress.
[449380.541321] I/O error, dev mmcblk0, sector 7765368 op 0x0:(READ) flags 0x0 phys_seg 1 prio class 2
[449388.733138] mmc0: Got data interrupt 0x00000002 even though no data operation was in progress.
[449396.925133] mmc0: Got data interrupt 0x00000002 even though no data operation was in progress.
[449405.117108] mmc0: Got data interrupt 0x00000002 even though no data operation was in progress.
[449405.117275] I/O error, dev mmcblk0, sector 7765368 op 0x0:(READ) flags 0x0 phys_seg 1 prio class 2
[449413.310124] mmc0: Got data interrupt 0x00000002 even though no data operation was in progress.
[449421.502098] mmc0: Got data interrupt 0x00000002 even though no data operation was in progress.
[449429.694095] mmc0: Got data interrupt 0x00000002 even though no data operation was in progress.
[449429.694211] I/O error, dev mmcblk0, sector 7765368 op 0x0:(READ) flags 0x0 phys_seg 1 prio class 2
[449437.886141] mmc0: Got data interrupt 0x00000002 even though no data operation was in progress.
[449446.087120] mmc0: Got data interrupt 0x00000002 even though no data operation was in progress.
[449454.549091] mmc0: Got data interrupt 0x00000002 even though no data operation was in progress.
[449454.549235] I/O error, dev mmcblk0, sector 7765368 op 0x0:(READ) flags 0x0 phys_seg 1 prio class 2
dmesg above seems to indicate that the SD card could be failing (https://forums.raspberrypi.com/viewtopic.php?t=382060).
Is there any way to further diagnose this from the CLI? Or what next steps do you recommend?